10. Support Vector Machine
Support Vector Machine
Support Vector Machine or "SVM" is just a funny name for a particular supervised machine learning algorithm that allows you to characterize the parameter space of your dataset into discrete classes. If you're new to machine learning, now might be a good time to check out Udacity's free Intro to Machine Learning Course, where SVMs and many other powerful algorithms are discussed in detail.
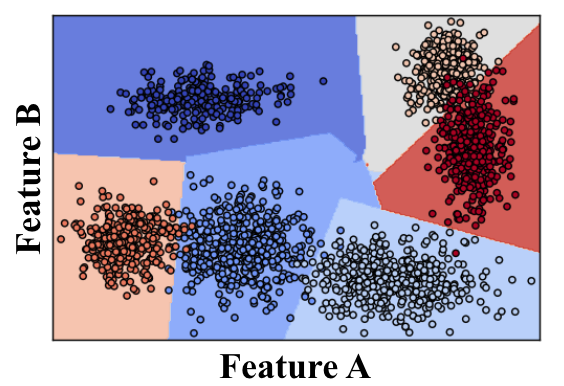
SVMs work by applying an iterative method to a training dataset, where each item in the training set is characterized by a feature vector and a label. In the image above, each point is characterized by just two features, A and B. The color of each point corresponds to its label, or which class of object it represents in the dataset.
Applying an SVM to this training set allows you to characterize the entire parameter space into discrete classes. The divisions between classes in parameter space are known as "decision boundaries", shown here by the colored polygons overlaid on the data. Having created decision boundaries means that when you're considering a new object for which you have features but no label, you can immediately assign it to a specific class. In other words, once you have trained your SVM, you can use it for the task of object recognition!
SVMs in Scikit-Learn
The Scikit-Learn or sklearn package in Python offers a variety of SVM implementations to choose from. For our purposes we'll be using a basic SVM with a linear kernel because it tends to do a good job at classification and run faster than more complicated implementations, but I'd encourage you to check out the other possibilities in the sklearn.svm package.
Training Data
Before we can train our SVM, we'll need a labeled dataset! To quickly generate some data, we'll use the cluster_gen() function that we defined in the previous lesson on clustering for segmentation. Now, however, we'll have the function output labels for each of the cluster data points as well as the x and y positions (check out the generate_clusters.py tab in the quiz below for details). You'll call it like this:
n_clusters = 5
clusters_x, clusters_y, labels = cluster_gen(n_clusters)
In this case, your features are the x and y positions of cluster points and the labels are just numbers associated with each cluster. To use these as training data, you need to convert to the format expected by sklearn.svm.SVC(), which is a feature set of shape (n_samples, m_features) and labels of length n_samples (in this case, n_samples is the total number of cluster points and m_features is 2). It's common in machine learning applications to call your feature set X and your labels y. Given the output format from cluster_gen() you can create features and labels like this:
import numpy as np
X = np.float32((np.concatenate(clusters_x), np.concatenate(clusters_y))).transpose()
y = np.float32((np.concatenate(labels)))
Once you've got the training data sorted out, sklearn makes it super easy to create and train your SVM!
from sklearn import svm
svc = svm.SVC(kernel='linear').fit(X, y)
And in the exercise below you can plot up the result! Explore what happens with different datasets. You can change the number in the np.random.seed(424) statement to generate a different dataset. Check out the documentation for sklearn.svm.SVC() to see which parameters you can tweak and how your results vary.
Start Quiz: